Statistics- Bell Curve
Driving test scores
Mode(s): 26, 28, 34
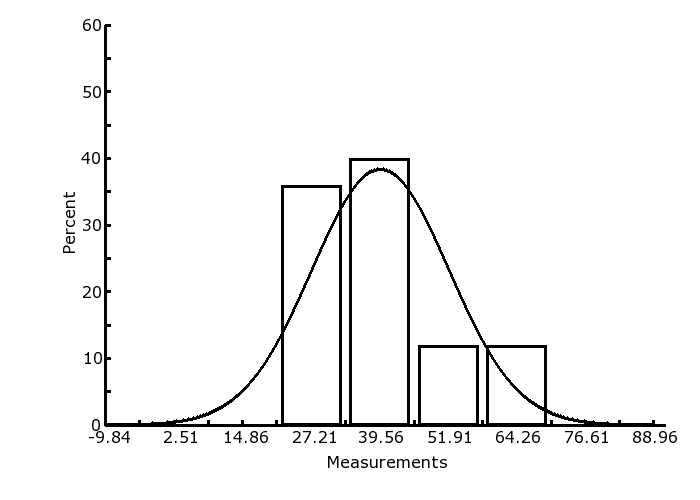
Mean: 39.56
Median: 35.5
Standard Deviation: 12.35273
Mode: To find the mode you simply look at which scores , appear frequently. Which number appears the most, in some cases you might not have a mode or you may have more than one mode. This graph had three scores that all appeared twice therefore the modes for this graph is 26, 28, and 34.
Mean: To find the mean you have to find the average of all the scores. You add all the scores together and divide by the number of total scores. For this graph I added up all the scores and divided by 25, because I had 25 scores. The mean for this graph is 39.56.
Median: To find the median you have to arrange your scores from least to greatest or vice versa, and pick the score that is in the middle. If you have an odd number of scores you will have to take the two scores in the middle and find the average. You will have to add the two scores together and divide by two, this will give you the median. To find the median for this graph I had to take the two middle numbers which were 35 and 36 and then find the average and divide by two. The median for this graph is 35.5.
The values that make up the three deviations are 2.51, 14.86, 27.1, 39.56, 51.91, 64.26, and 76.61.
These deviations are made up by the 68, 95, 99.7 rule. The rule states that 65% of data lies within one standard deviation of the mean, and approximately 95% of the data lies within the second deviations of the mean, and approximately 99.7% of the data lies within the third standard deviations of the mean. The mean is in the center and is 39.56, if you go to the right one time then you see 51.91 and if you go to the left one time then you see 27.21. From 27.1 to 51.91 is the first standard deviation and from 14.86 to 64.26 is the second standard deviation and from 2.51 to 76.61 is the third standard deviation.
